United States influenza statistics by flu season
US influenza statistics by flu season. From the Centers for Disease Control and Prevention page called "Disease Burden of Influenza": "Each year CDC estimates the burden of influenza in the U.S. CDC uses modeling to estimate the number of influenza illnesses, medical visits, flu-associated hospitalizations, and flu-associated deaths that occur in the U.S. in a given season. The methods used to calculate these estimates are described on CDC’s webpage, How CDC Estimates the Burden of Seasonal Influenza in the U.S."[1][2]
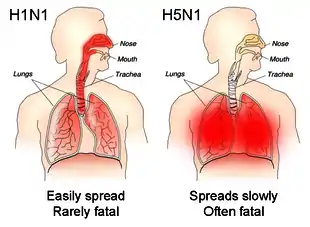
The different sites of infection (shown in red) of seasonal H1N1 versus avian H5N1. This influences their lethality and ability to spread.
Hospitalizations and deaths
- UI = uncertainty interval.
*2017–2018, 2018–2019, and 2019–2020 are preliminary estimates.
| Season | Hospitalizations | Deaths | ||
|---|---|---|---|---|
| Estimate | 95% UI | Estimate | 95% UI | |
| 2010–11 | 290 | 270–350 | 37 | 32–51 |
| 2011–12 | 140 | 130–190 | 12 | 11–23 |
| 2012–13 | 570 | 530–680 | 43 | 37–57 |
| 2013–14 | 350 | 320–390 | 38 | 33–50 |
| 2014–15 | 590 | 540–680 | 51 | 44–64 |
| 2015–16 | 280 | 220–480 | 23 | 17–35 |
| 2016–17 | 500 | 380–860 | 38 | 29–61 |
| 2017–18* | 810 | 620–1,400 | 61 | 46–95 |
| 2018–19* | 490 | 390–770 | 34 | 26–53 |
| 2019–20* | 400 | 350–500 | 22 | 18–29 |
Symptomatic illnesses and medical visits
- UI = uncertainty interval.
*2017–2018, 2018–2019, and 2019–2020 are preliminary estimates.
Note: The numbers below have been rounded off to millions.
| Season | Symptomatic Illnesses | Medical Visits | ||
|---|---|---|---|---|
| Estimate | 95% UI | Estimate | 95% UI | |
| 2010–11 | 21,000,000 | 20,000,000–25,000,000 | 10,000,000 | 9,000,000–12,000,000 |
| 2011–12 | 9,000,000 | 9,000,000–12,000,000 | 4,000,000 | 4,000,000–6,000,000 |
| 2012–13 | 34,000,000 | 32,000,000–38,000,000 | 16,000,000 | 15,000,000–18,000,000 |
| 2013–14 | 30,000,000 | 28,000,000–33,000,000 | 13,000,000 | 12,000,000–15,000,000 |
| 2014–15 | 30,000,000 | 29,000,000–33,000,000 | 14,000,000 | 13,000,000–16,000,000 |
| 2015–16 | 24,000,000 | 20,000,000–33,000,000 | 11,000,000 | 9,000,000–15,000,000 |
| 2016–17 | 29,000,000 | 25,000,000–45,000,000 | 14,000,000 | 11,000,000–23,000,000 |
| 2017–18* | 45,000,000 | 39,000,000–58,000,000 | 21,000,000 | 18,000,000–27,000,000 |
| 2018–19* | 36,000,000 | 31,000,000–45,000,000 | 17,000,000 | 14,000,000–21,000,000 |
| 2019–20* | 38,000,000 | 34,000,000–47,000,000 | 18,000,000 | 15,000,000–22,000,000 |
See also
- Influenza pandemic
- 2009 swine flu pandemic
- COVID-19 pandemic in the United States. Statistics section.
- Template:2019–20 coronavirus pandemic data. Flu statistics are often compared to coronavirus statistics.
- COVID-19 pandemic cases. More statistics for comparison purposes.
- COVID-19 pandemic deaths. More statistics for comparison purposes.
- Influenza vaccine
- Bird flu
- Human flu
- Swine flu
- Horse flu
- Dog flu
- Freshers' flu
- 2012–2013 flu season
- 2017–2018 United States flu season
- 2019–2020 United States flu season
References
- "Disease Burden of Influenza". Centers for Disease Control and Prevention, National Center for Immunization and Respiratory Diseases (NCIRD). 1 Oct 2020. Retrieved 9 Jan 2021.
- "What you need to know about influenza (flu) from CDC". Centers for Disease Control and Prevention, (NCIRD)..
This article is issued from Wikipedia. The text is licensed under Creative Commons - Attribution - Sharealike. Additional terms may apply for the media files.